3D Sterprofiel & Datavisualisatie
Het hulpmiddel voor 3D-datavisualisatie kan 3D-grafieken plotten van het geselecteerde gebied in de afbeelding. Dit is bijzonder nuttig voor astrofotografen die een profiel willen visualiseren van een ster die zij willen gebruiken om op in te stellen of op te volgen. Wetenschappers kunnen dit gebruiken om een dwarsdoorsnede te maken van de gegevens om de relatieve helderheden in de afbeelding te begrijpen. Bovendien kan men hiermee visueel op een nieuwe manier bekijken wat er gaande is in de verzamelde gegevens.
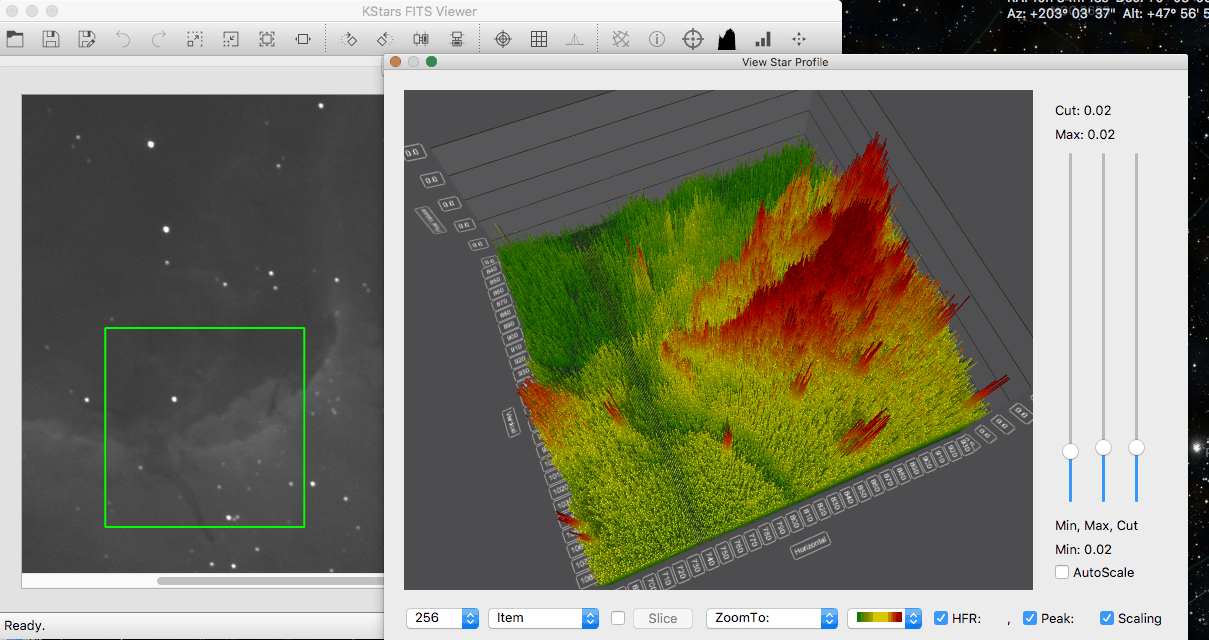
U kunt deze nieuwe eigenschap gebruiken door te klikken op het pictogram
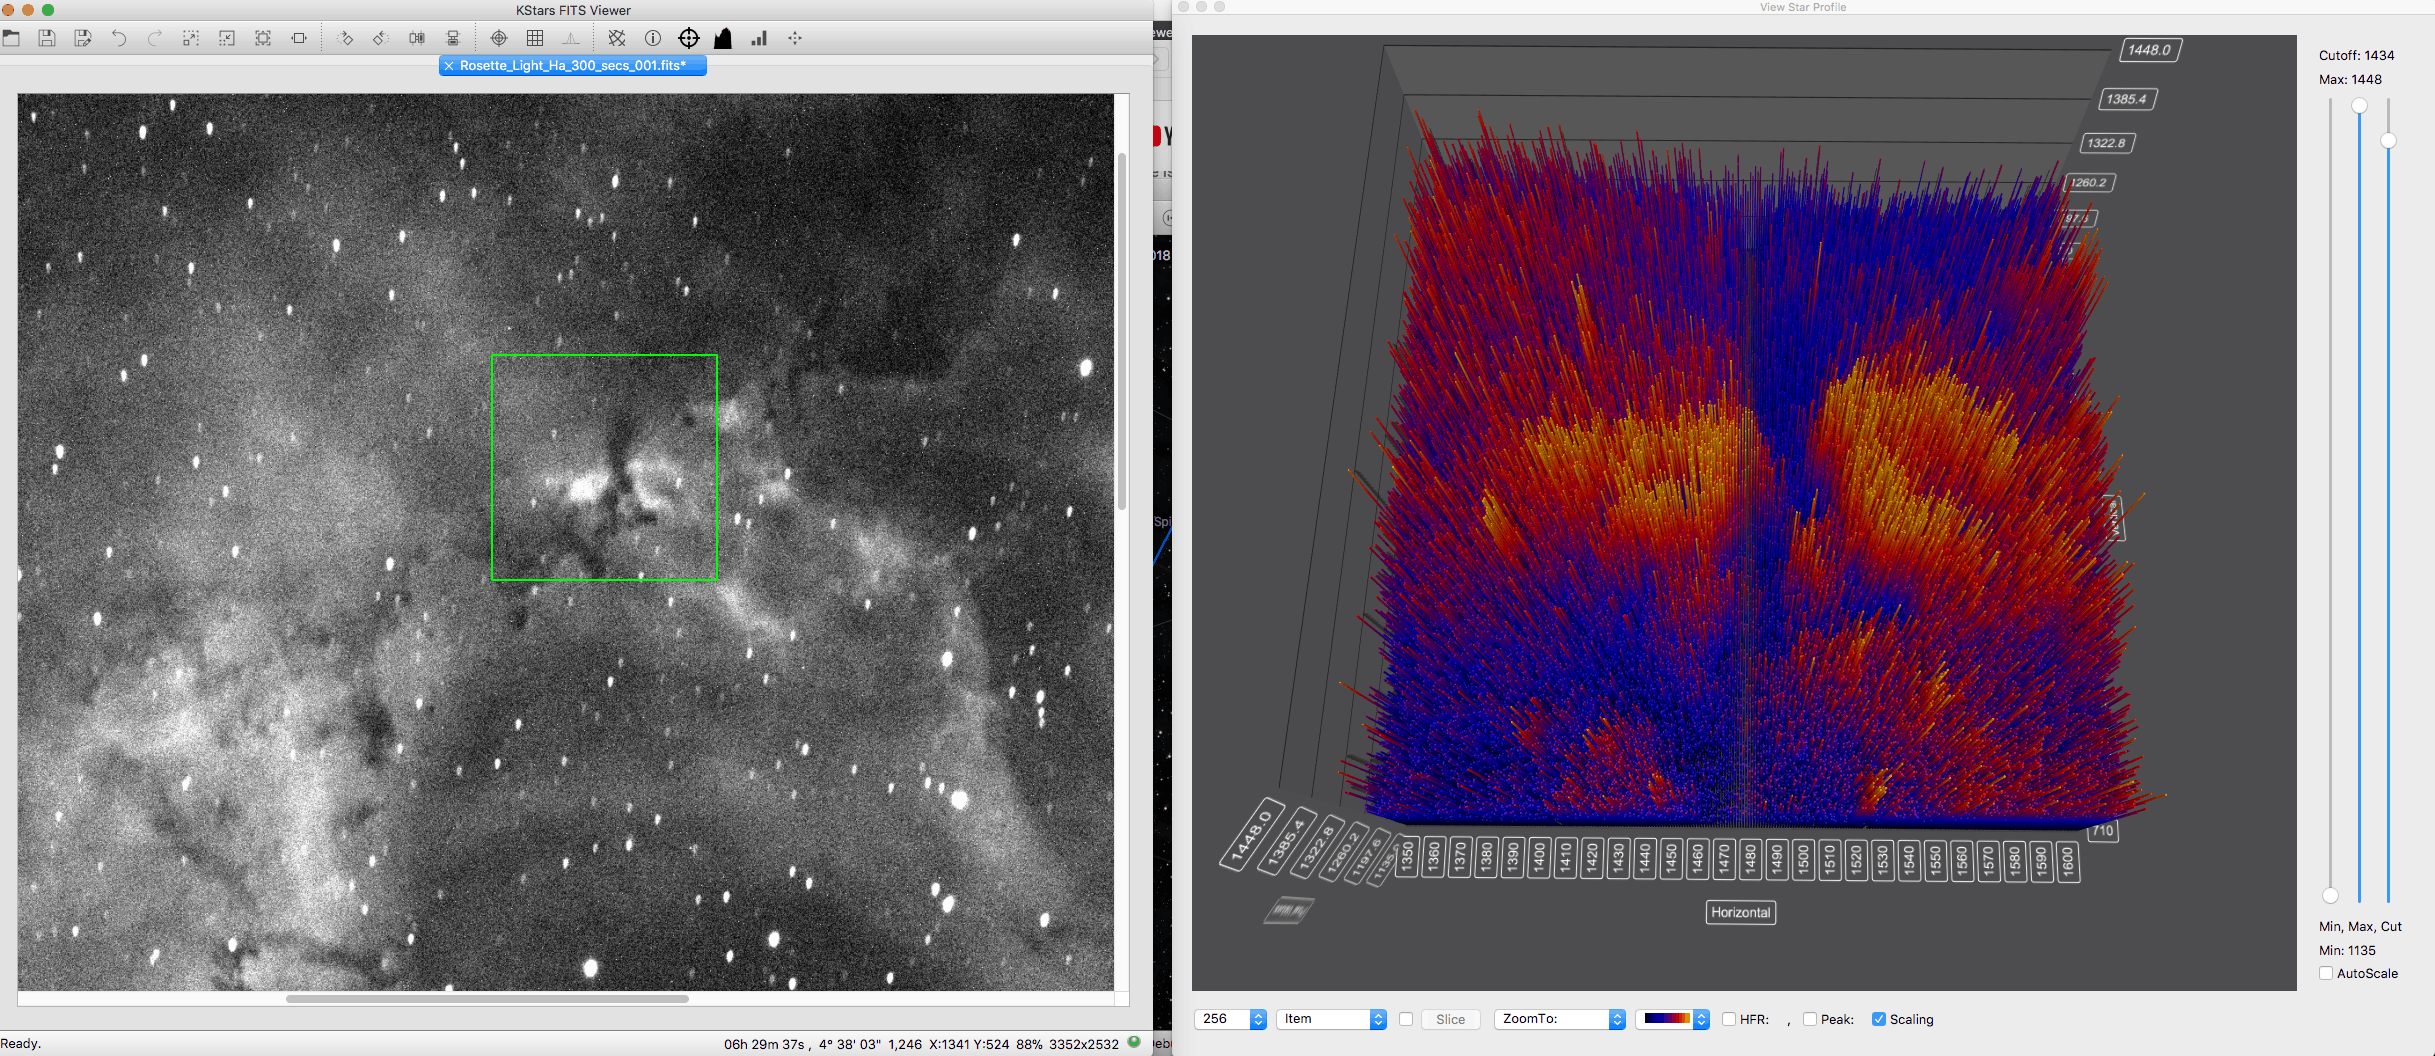
Sterprofiel bekijkenin een van de modules van Ekos, of in de FITS-viewer. Het met het groene volgvakje geselecteerde gebied wordt dan zichtbaar in de 3D-grafiek, zoals hierboven getoond. De gebruiker beschikt dan onderin over een van de volgende werkbalken.
Helemaal links kan de gebruiker in de combobox voor samplegrootte de grootte selecteren van het uit te snijden gebied, zoals getoond in de grafiek. Deze optie is alleen beschikbaar in het
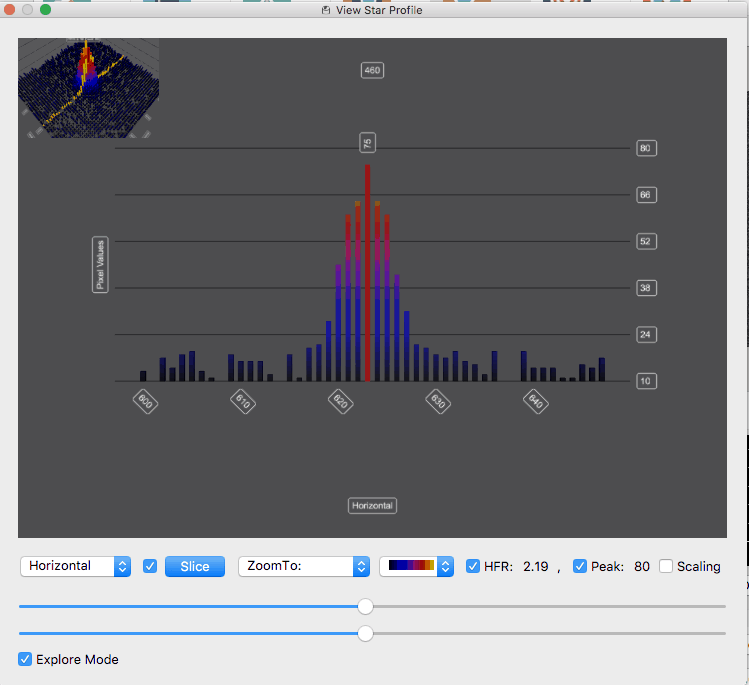
Samenvattingsschem, de Uitlijnmodule en de FITS-viewer. In de tweede combobox kan de gebruiker een enkel item instellen, of een rij, of een kolom, of pixels. De schuifknop wordt actief als de gebruikerRijofKolomselecteert. De grafiek wordt in doorsneemodus gebracht, zodat de gebruiker een dwarsdoorsnede ziet van de afbeelding. Als derde is er een keuzevakje met twee schuifknoppen, waarmee de gebruiker de selectie kan wijzigen. Dit is erg nuttig in de schuifmodus, voor het veranderen van het geselecteerde punt, en de doorsnede te verplaatsen in de grafiek. U kunt het ook gebruiken in het normale beeld, in deVerkenmoduszodat de gebruiker overal in de afbeelding kan inzoomen om de pixels te bekijken.
Ook is er de combobox
Zoom naar, waarmee de gebruiker in de grafiek kan zoomen naar verschillende vooringestelde locaties. Vervolgens de combobox voor het kiezen van het kleurschema van de grafiek. Ook zijn er de keuzevakjes voor HFR- en Piekwaarden voor het tonen van de HFR- en Piekwaarden van elke ster in de afbeelding. Ook wordt een ervan onderin het scherm zichtbaar. Tenslotte het keuzevakje voor de schaal, waarmee het zijpaneel voorSchalenwordt geactiveerd. In dat paneel zijn drie schuifknoppen, een ervan voor het instellen van de minimum waarde in de grafiek of het “zwarte punt”, een voor het instellen van de maximum waarde in de grafiek, of “Witte punt” en een derde die standaard uit staat, en waarmee de afsnijwaarde kan worden ingesteld voor de in de grafiek getoonde gegevens.
De derde schuifknop is erg nuttig voor het verwijderen van te grote piekwaarden, zodat de fijnere details in de afbeelding kunnen worden bestudeerd. Er is bovenin een keuzevakje voor het aan/uitzetten van de schuifknop voor afsnijden. En er is tenslotte onderin ook de knop voor
Autoschalen. Hiermee worden ook de schuifknoppen geschaald als u verschillende gedeelten van de afbeelding bemonstert. Niet alleen het tonen van de data, maar ook minima en maxima van de schuifknoppen worden beïnvloed. Indien u autoschalen uitzet, worden alle verschillende gebieden in de afbeelding op dezelfde schaal getoond. Een nuttig gebruik hiervan is autoschalen een bepaald gebied in de afbeelding aan te zetten, de schuifknoppen voor min, max en afsnijden goed in te stellen, autoschalen daarna uit te zetten, en met deze instellingen de andere gebieden in de grafiek te bekijken.