
Analyseren
Inleiding
In de analysemodule wordt het gebeuren tijdens een opnamesessie opgenomen en weergegeven. Dit betekent dat die zelf geen invloed heeft op het maken van de afbeeldingen, maar alleen een beschrijving geeft van wat er is gebeurd. Sessies worden opgeslagen in een map analyze, naast een map voor loggen. De erin opgeslagen bestanden .analyse kunnen in het tabblad Analyseren worden bekeken. Analyseren kan ook gegevens van de huidige opnamesessie weergeven.
Wanneer een nieuwe sessie begint (bijv. Ekos is bij het ochtendgloren losgekoppeld, daarna opnieuw verbonden bij zonsondergang) zal het systeem starten met het schrijven van een nieuw bestand .analyze. (Dit gedrag kan gecontroleerd worden vanuit de Analyse-instellingen bereikbaar via klikken op de optieknoppen rechtsonder.)
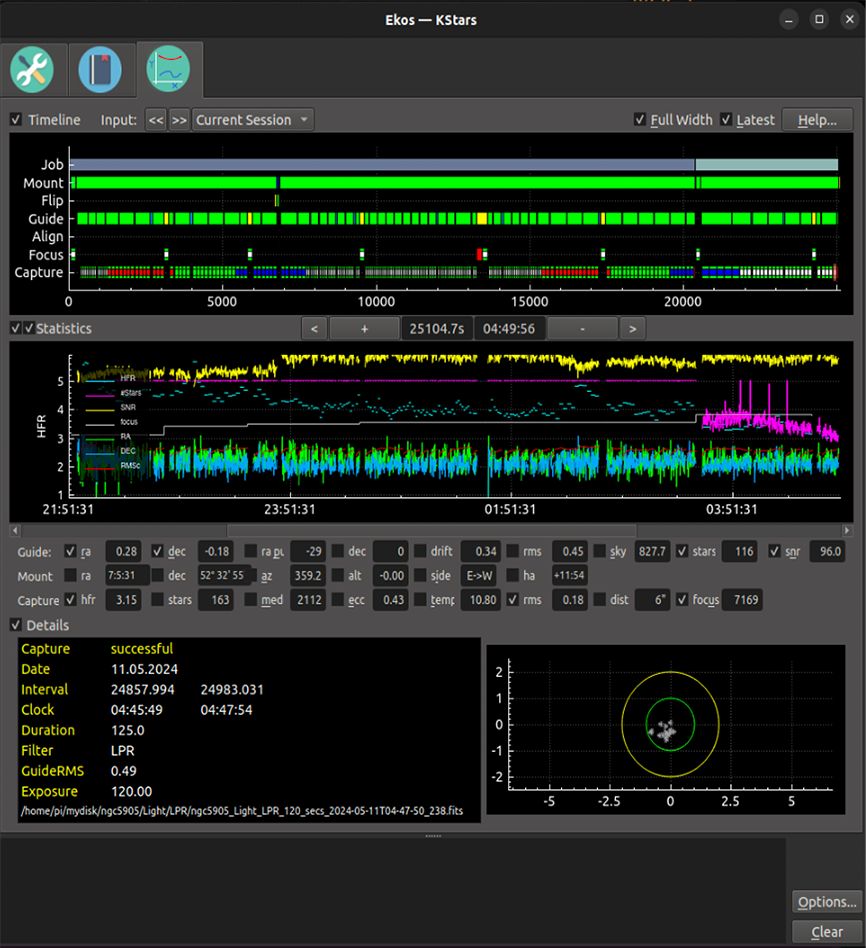
Er zijn twee hoofdgrafieken, Tijdlijn en Stats. Zij werken samen-zij tonen altijd het zelfde tijdsinterval van de Ekos-sessie, hoewel op de x-as van de Tijdlijn het aantal seconden wordt getoond vanaf de start van het loggen, en in Stats de kloktijd. Op de x-as kan met de knoppen +/- worden in en uit gezoomd of met de standaard sneltoetsen (bijv. inzoomen == Ctrl++). Op de x-as kan naar links of rechts worden gezwenkt met de linker- en rechter pijltoetsen. U kunt de huidige opnamesessie bekijken, of oude sessies door bestanden .analyze in te lezen, in het afrolmenu van Invoer. Door de knoppen << en >> te gebruiken kunt u de vorige of de volgende bestanden .analyze chronologisch tonen. Door Volle Breedte te kiezen ziet u alle gegevens en met Laatste ziet u de meest recente gegevens (u kunt de breedte met zoomen regelen).
De drie hoofdschermen kunnen verborgen worden om meer ruimte te maken voor de andere schermen. Er zijn keuzevakken links van de sectietitels (Tijdlijn, Statistieken en Details) die de schermen inschakelen en verbergen.
Tijdlijn
De Tijdlijn toont de processen van Ekos en wanneer die actief waren. Bijvoorbeeld, op de regel Opname staat wanneer opnames werden gemaakt (witter groene voor RGB of met kleur gecodeerd door het filter) en wanneer afgebroken (als rode secties getoond). Klikken op een opnamesectie geeft informatie over die afbeelding, na dubbelklikken ziet u de opgenomen afbeelding in een fitsviewer (programma voor het tonen van een fits-afbeelding), indien aanwezig.
Notitie
Indien u de opgenomen afbeelding verplaatst, kunt u een andere map in de pagina analyse-instellingen instellen via de knop Opties rechtsonder. Deze andere map zou vooraf het basisdeel van het originele bestand hebben en zou gecontroleerd worden of het afbeeldingsbestand niet op zijn originele locatie staat.
Klikken op een Focus-segment geeft focus-informatie en toont positie versus HFR -metingen voor die sessie. Klikken op een Volger-segment toont een driftplot voor die sessie (bij volgen) en de RMS-statistieken. Klikken op andere tijdlijnen geeft status-informatie.
Statistiek
In de grafiek voor Statistieken kan een aantal statistieken worden weergegeven. Daar zijn er teveel van om die op een leesbare manier te noemen, dus kiest u die met behulp van de keuzevakjes. Een goede manier om hiermee te beginnen is met die voor rms, ruis (met de interne volger en SEP Multistar) en hfr (indien u auto-berekenen heeft gekozen in de FITS-opties). Experimenteer met de andere.
De linker as is initieel alleen van toepassing voor RA/DEC-fout, driften, RMS-fout, RA/DEC pulsen en HFR, geplot in boogseconden en standaard gezet op een reeks van -2 tot 5 boogseconden. Echter klikken op een van de vakken onder de statistiekengrafiek (die een statistiekwaarde toont) zal die statistiekreeks instellen als de reeks getoond op de linker as. Dubbelklikken op dat vak zal een menu tonen waarmee u de geplotte y-reeks van de statistieken kan aanpassen (bijv. het op automatisch zetten, expliciet de reeks invoeren, het terugzetten tot zijn standaard waarde en ook de kleur van die statistiekenplot wijzigen).
De statistiek getoond op de linker as kan ook geschaald worden (lastig) met het muiswiel. Het kan in breedte wijzigen door de muis op of neer over de linker getallen op de as te slepen. Ergens klikken in de statistiekgrafiek vult in de waarden van de getoonde statistieken. Activeren van het laatste vak maakt dat de meest recente waarde (uit een live sessie) de getoonde statistieken worden. Deze grafiek wordt gezoomd en horizontaal verschoven in samen met de tijdlijn.